
 Mobile
Communication Simulation
Performance
of Xmas Prototype
These demos require Java Plug-in 1.1.
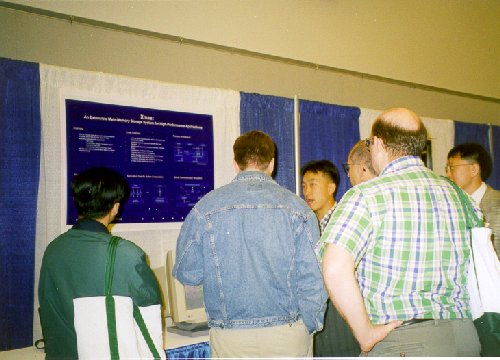
Jang Ho Park(the third from the left) and Prof. Sang K. Cha(the first from the right) are presenting Xmas at SIGMOD'98.
Mobile Communication Simulation
Demo Description |
Demo Preview |
Instruction |
||
Click the Image |
|
|
Performance of Xmas Prototype
Demo Description |
Demo Preview |
Instruction |
|
Click the Image |
|
Xmas Home Page
Knowledge and Data Engineering
Laboratory
School of Electrical Engineering
Seoul National University